
Community wellbeing in the ACT
How should we measure and track the wellbeing of our community as a whole?
Go to Challenge | 9 teams have entered this challenge.
Team Name:
Apples
Apples
PolEx (Policy Explorer) is a suite of interactive dashboards delivered via a software subscription service, where users can explore the different aspects of the Australian Capital Territory (ACT) Government's Wellbeing Framework with integrated data models.
The ACT Government's Wellbeing Framework enumerates and measures the things that represent quality of life to Canberrans. The launch of this Framework in 2020 along with the mission to “embed wellbeing in Government decision making”, sets an expectation of budget and regulatory mechanisms to influence wellbeing outcomes.
Crafting policy takes time and resources sometimes. PolEx dashboards assist policy makers to make data driven strategic recommendations. Users can create an engaging and localised perspective on policy proposals with an interactive dashboard of metrics that relate to various domains.
Click here to view a live demo of PolEx Health Module
Click here to see our PolEx product video
PolEx Health is the first module of the PolEx suite. PolEx Health addresses one of the “healthy lifestyle” indicators in the Health domain of the ACT Wellbeing Framework. It focuses on policy responses to obesity and chronic health conditions that may affect the next generation of Canberrans and our case study supports it.
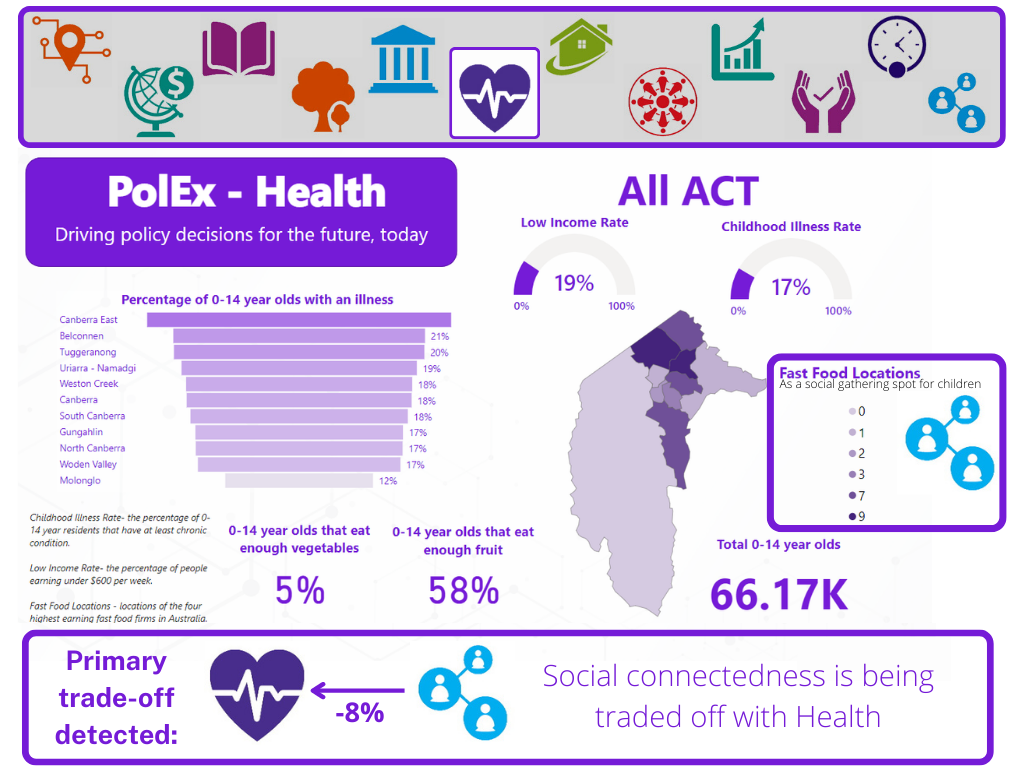
The image above shows the PolEx Health dashboard for the ACT region.
In this working proof of concept we present a sample of the PolEx database with metrics such as data on regional income, prevalence of childhood illness, and the density of social gathering spots for children that may impact their health.
In this instance the tool has identified that density of fast food locations are correlated with worse health outcomes in children, which for our well being domains means that health is being traded off for social connection.
Policy makers pushing for social activity will need to keep this connection in mind when working toward the well being of the community as a whole, and we explore this particular instance further in a case study.
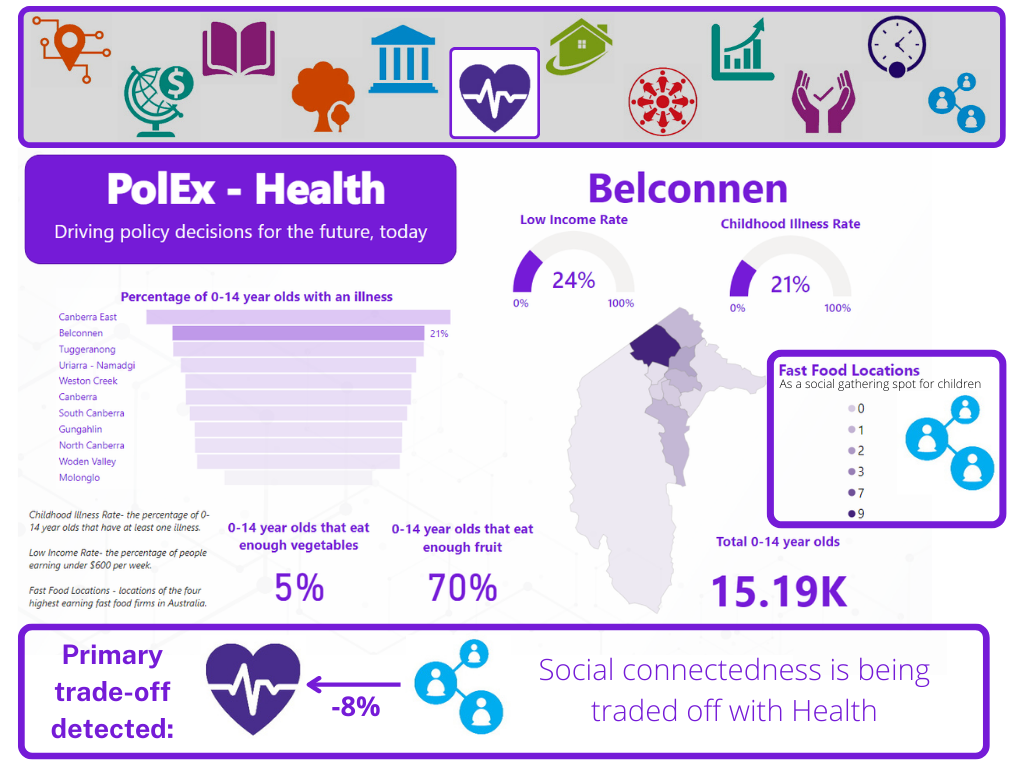
The image below shows a filtered dataset of ACT's Belconnen District.
This is the PowerBi file which contains the proof of concept dashboard.
Users will need to open the file with Power BI Desktop.
To demonstrate the utility of PolEx we have included a policy paper about the impact of locating fast food outlets near schools, with a discussion about effects of an obesogenic environment on community wellbeing. The accompanying dashboard, showing existing ACT Wellbeing Indicators alongside density of fast food locations is used to support the policy position and communicate its value to the ultimate decision-makers.
An advantage of the PolEx dashboard product is that new or alternative social indicators or policy levers can be added to augment the dashboard, and extracts from its high quality data visualisations can be embedded in text documents to support your proposed narrative.
The upcoming PolEx modules include:
- PolEx Community
- PolEx Education
- PolEx Environment
- PolEx Finance
- PolEx Housing
- PolEx Social
- PolEx Predictive: utilising projections from trusted data sources and predictive modelling to gauge the effects of your policy proposals.
R Script, PowerBI, HTML, Git, QGIS, Animaker
A single pane of data was created by processing and transforming data from different sources. This was completed using R. The data was then loaded into Power BI to create an interactive dashboard. The interactive map component was a shape map that utilised a TopoJSON file of the SA3 boundaries for Australia. QGIS was used to remove boundaries so that a smaller, ACT-only shape file was available to create the interactive map visual on the Power BI dashboard. This allows viewers to explore the insights that align with their needs at a local level.
Description of Use Several ACT Government wellbeing datasets were used to include additional information. This added to the overall dataset to allow additional angles of analysis to be explored.
Description of Use Australian Bureau of Statistics Census 2021 for metrics of spoken language (G13), income (G17), education attendance (G15), and health status (G19) standardised and combined using R script to form the core of the PolEx Health dataset, focused on health outcomes for children in the ACT.
Description of Use Australian Bureau of Statistics Census 2021 for metrics of spoken language (G13), income (G17), education attendance (G15), and health status (G19) standardised and combined using R script to form the core of the PolEx Health dataset, focused on health outcomes for children in the ACT.
Description of Use Several ACT Government wellbeing datasets were used to include additional information. This added to the overall dataset to allow additional angles of analysis to be explored.
Description of Use As an additional measure of income, SEIFA data was added to the end dataset. This allowed cross-referencing of income to help support the overall model.
Description of Use Several ACT Government wellbeing datasets were used to include additional information. This added to the overall dataset to allow additional angles of analysis to be explored.
Description of Use ACT Government population data was used as a control variable for regional populations by allowing comparisons to be made with ABS datasets.
Description of Use Different data sources for statistical areas were lacking clean joining information, so the ABS SAs dataset was incorporated into our data cleaning system to ensure consistency and easy connections between disparate data sources.
Description of Use To mesh different levels of GIS data the ABS address to SA converter was used to match different fast food outlets within ACT SA3s, which were then integrated into the PolEx Health dataset.
Description of Use To explore wellbeing as a whole and understand the trade-offs between different ACT Wellbeing Framework Domains, addresses for Canberran major fast food locations were collected to explore negative linkages between the density of unhealthy social hot-spots for children associated with health outcomes.
Description of Use To explore wellbeing as a whole and understand the trade-offs between different ACT Wellbeing Framework Domains, addresses for Canberran major fast food locations were collected to explore negative linkages between the density of unhealthy social hot-spots for children associated with health outcomes.
Description of Use To explore wellbeing as a whole and understand the trade-offs between different ACT Wellbeing Framework Domains, addresses for Canberran major fast food locations were collected to explore negative linkages between the density of unhealthy social hot-spots for children associated with health outcomes.
Description of Use To explore wellbeing as a whole and understand the trade-offs between different ACT Wellbeing Framework Domains, addresses for Canberran major fast food locations were collected to explore negative linkages between the density of unhealthy social hot-spots for children associated with health outcomes.
Description of Use Australian Bureau of Statistics Census 2021 for metrics of spoken language (G13), income (G17), education attendance (G15), and health status (G19) standardised and combined using R script to form the core of the PolEx Health dataset, focused on health outcomes for children in the ACT.
Description of Use Australian Bureau of Statistics Census 2021 for metrics of spoken language (G13), income (G17), education attendance (G15), and health status (G19) standardised and combined using R script to form the core of the PolEx Health dataset, focused on health outcomes for children in the ACT.
Go to Challenge | 9 teams have entered this challenge.
Go to Challenge | 9 teams have entered this challenge.
Go to Challenge | 24 teams have entered this challenge.