
The 2021 Australian Census
How might we link the 2021 Census data with open data to highlight or solve a challenge Australians are facing
Go to Challenge | 24 teams have entered this challenge.
Team Name:
S6
Team Members:
S6
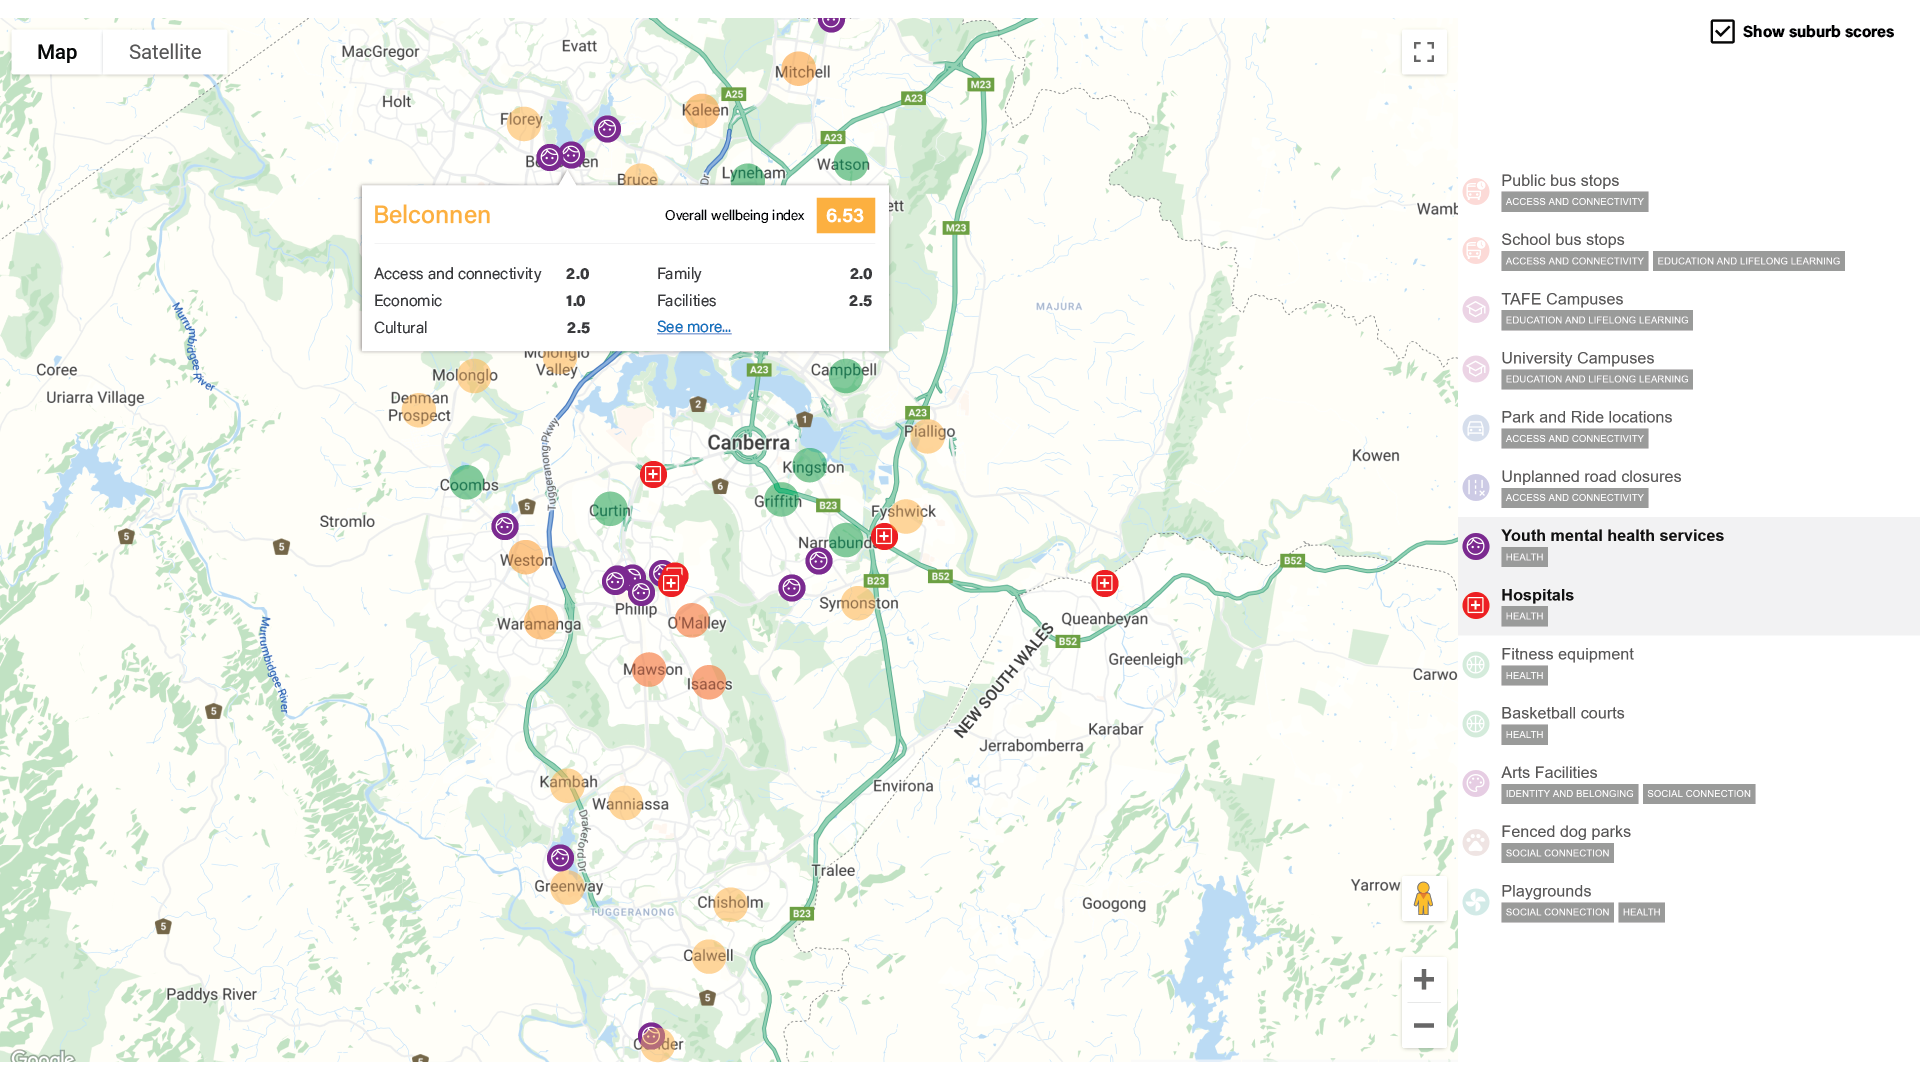
Growth.ACT is a conclusive tool with the power to streamline all information around wellbeing, to help decision makers effectively organize their resources to see how the factors like socio-economic status, access and connectivity, cultural diversity, family background and psychological distress of suburbs in the ACT, with data collected from various sources like ABS and ACT government and analyses it with the dynamic flow of data, providing a better solution for the greater good of the community.
Growth.ACT is a website that provides a platform to visualize and quantify the wellbeing index to measure and track the wellbeing of the community in the ACT. Provides an opportunity for the government to analyse how to spend their expenditure on health services and promote various forms of facilities.
https://raw.githubusercontent.com/doubleedesign/govhack22/master/concept-mockup.png
Community wellbeing in the ACT is the challenge that sparked our data story like any other GovHack team. We realised social support plays a huge role in the mental health and wellbeing of the community. It is rather difficult to measure the social support provided to each individual as it consists of the personal relationships in their lives and their interactions. A viable and measurable form of tracking the wellbeing of the community for the government would be through the number of facilities provided in each suburb of the Australian Capital Territory which reduce the factors of inaccessibility and connectivity, financial burdens, cultural diversity, and acceptance as well as home lifestyle for better mental health services. We used datasets from the ACT Government, ABS, and external datasets to produce a website which maps the wellbeing index. The goal of Growth.ACT is to provide the government with a more visualised form of data representation to compare the wellbeing index between suburbs and the different factors affecting it, to evaluate where the money needs to be spent wisely and if more services need to be constructed in disadvantaged areas. We have centred our attention on the age group 15-24 years old and focused primarily on mental health wellbeing as it is rather broad to cover the entirety of the ACT population. Through our website Growth.ACT, the Government and many organisations can refer to the map addressed on the website to analyse the psychological distress within the suburbs and analyse whether existing facilities and services regarding mental health/wellbeing are affecting the suburb positively or more wellbeing services are required to target a diverse range of individuals within the community who identify to different groups.
Description of Use For pinning the details on the map for fitness parks, in the suburbs of ACT and other details in the map for visualization, for the indication to wellbeing.
Description of Use Corelation, mapping and visualisation.
Description of Use Used for correlation and mapping, along with visualisation.
Description of Use Used the grouping to describe areas with socio-economic disparity to corelate with the wellbeing.
Go to Challenge | 24 teams have entered this challenge.
Go to Challenge | 9 teams have entered this challenge.