Tracking city carbon emissions
The City of Adelaide is internationally recognised for our commitment to report and reduce carbon emissions. Our community has a shared ambition for the city and North Adelaide to become a carbon neutral city.
Progress Snapshot within the community
As a community, we are taking action to reduce our emissions.
Tracking city carbon emissions
More than 15 MW
of solar capacity installed in the City and North Adelaide, quadrupled since 2016
65% renewable electricity
in the South Australian grid
Over 54
public electric vehicle chargers installed since 2017, the amount of electricity dispatched increased 10-fold to 2023
Over 220
Carbon Neutral Adelaide partners
Over 700 projects
supported by $1.5 million in incentives for sustainability provided by the Council
50 small business
received free energy efficiency audits in 2021
23 small businesses
received over $81,000 towards efficiency upgrades
1st organic waste separation
trial for outdoor spaces in Adelaide’s Rundle Mall
Trends in city emissions
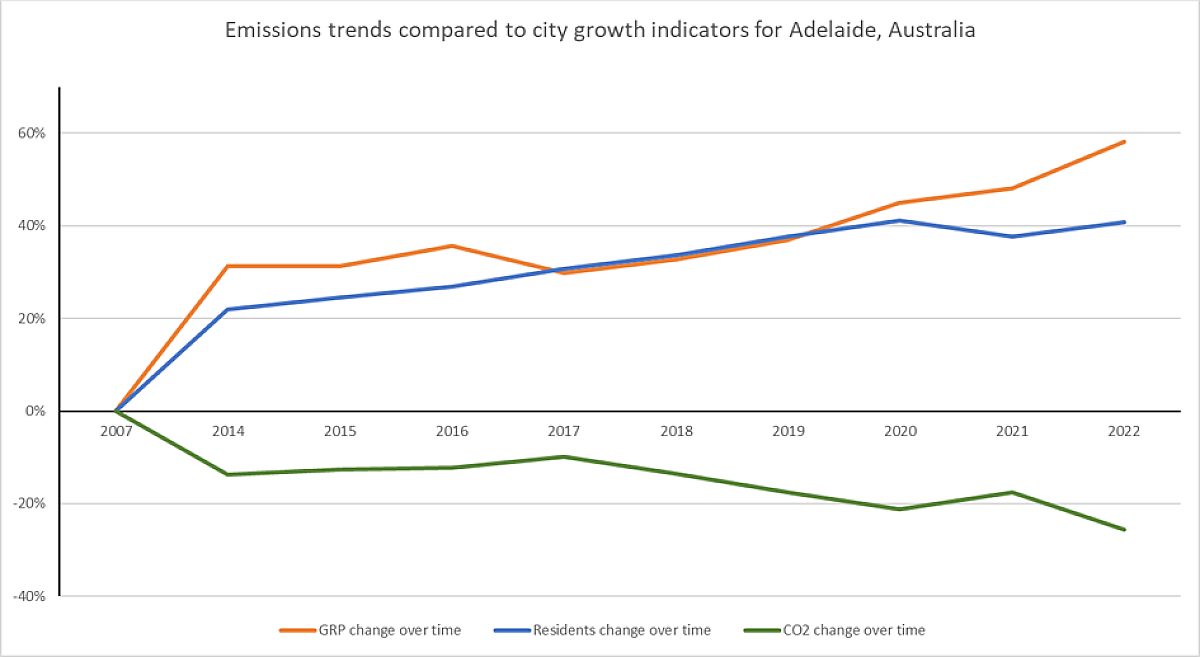
City-wide emissions have been decreasing, while the city itself has been growing.
Between 2007 and 2022 financial years our residential population grew by 41 per cent and Gross Regional Product increased by 58 per cent. See more economic and demographic insights.
Over this time overall greenhouse gas emissions decreased by 26 per cent.
- Emissions from electricity decreased by 62 per cent – primarily due to the State’s transition to renewable electricity
- Emissions from gas increased by 10 per cent
- Emissions from transport increased by 64 per cent – which reflects growth in city users
- In the financial year 2022, waste emissions make up about 5 per cent of the total, and the collection of this data is being improved.
Some other key points are:
- In financial year 2022, 36 per cent of the emissions were from commercial buildings and apartments, mostly due to electricity use. As South Australia switches to a greener grid, emissions due to electricity use are decreasing. Emissions from gas usage remain the same.
- Private car travel and aviation made up the majority of transport-related emissions. These emissions are more than trains, trucks, bus, and commercial vehicles combined.
Explore city carbon emissions
The City of Adelaide has been tracking community greenhouse gas emissions through preparing inventories since 2007. In 2015, we established a shared ambition for our city to be carbon neutral.
The visualisations below provide a detailed breakdown of community greenhouse gas emissions for you to explore.
Tips for reading the charts
- Use the arrows to scroll between the three pages.
- Click on any labels or charts to understand different measurements.
- Deep dive into emission sources or explore trends in energy and transport.
How is it measured?
The City of Adelaide community greenhouse gas emissions inventory is prepared in accordance with the Global Protocol for Community Scale Greenhouse Gas Emissions Inventories.
The protocol measures the emissions within the City of Adelaide boundary, using “scopes” which allows international comparisons (see definitions). This methodology is used to report internationally to the CDP platform (formerly Carbon Disclosure Project) on climate data and action.
What is the City of Adelaide doing?
Like many global cities, increases in some emissions sources are associated with growing populations and this is a world-wide challenge. See Adelaide’s journey to be a carbon neutral city, how we are reducing emissions from Council operations, and efforts to be climate ready.
Did you know?
The South Australian Government reports that over 70 per cent of South Australia’s electricity is provided by renewable sources, with period of 100 per cent.
In 2022, Adelaide scored the top grade on climate action from the international reporting platform CDP (formerly Carbon Disclosure Project). This placed the City on the A-list, among the 142 best performing city climate actors globally.